The Lisbon and Tejo Valley Region, the capital region of Portugal, comprises the 3 NUTS II regions: Greater Lisbon, Setúbal Peninsula, and West and Tejo Valley; and is further divided into NUTS III regions: Greater Lisbon, Setúbal Peninsula, West, Tejo Floodplain and Middle Tejo, covering an area of 12,216 km2. It is located on the West Coast of Europe and is the westernmost border of the European continent, which gives it a privileged geostrategic location.
One region, 3 NUTS II regions, 5 NUTS III regions, 52 municipalities and 355 parishes.
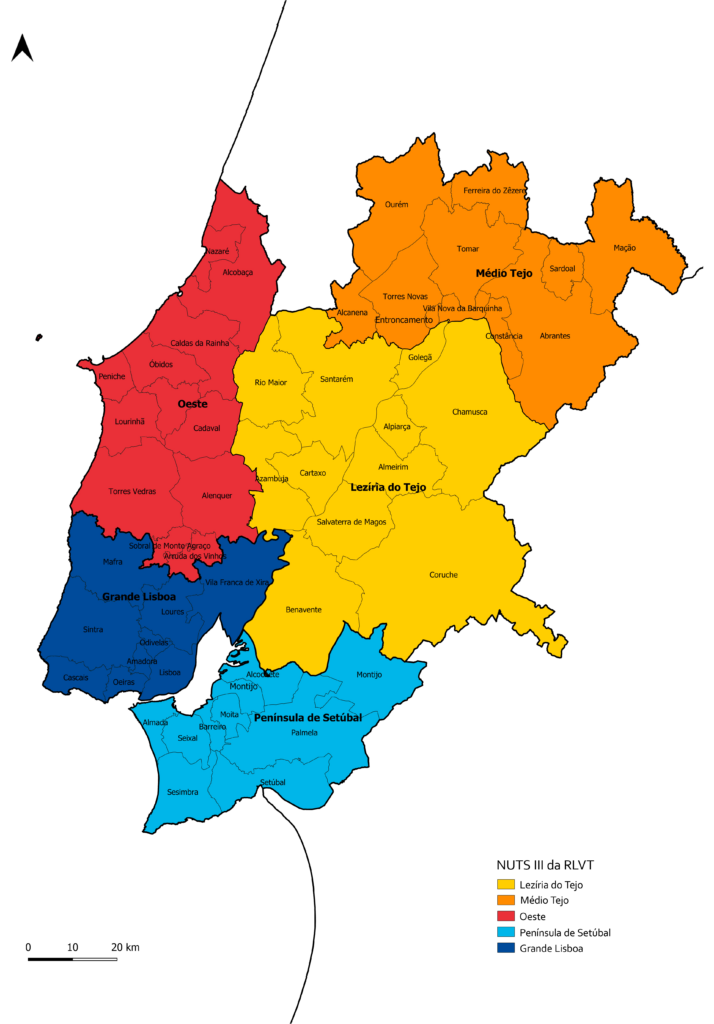
Figure 1 – Lisbon and Tejo Valley Region, NUTS III and municipalities (2024)
Source: SIG CCDR LVT, I.P.
See Map and List of Municipalities.
The territory covered by the CCDR-LVT, I.P, is made up of the Lisbon and Tejo Valley Region, the capital region of Portugal, and which includes 3 NUTS II: Greater Lisbon, Setubal Peninsula, and West and Tejo Valley; broken down into NUTS III: Greater Lisbon, Setubal Peninsula, West, Tejo Floodplain and Middle Tejo, in an area of 12,216 km2, which corresponds to 13.3% of the national territory. It is located on the West Coast of Europe and is the westernmost border of the European continent, which gives it a privileged geostrategic location. The Lisbon and Tejo Valley Region is made up of 3 NUTS II, 5 NUTS III, 52 Municipalities and 355 Parishes.
In 2022 (Census 2021), the resident population in the Lisbon and Tejo Valley Region was estimated at 3,750,858 residents, which corresponds to 35.83% of the Portuguese population.
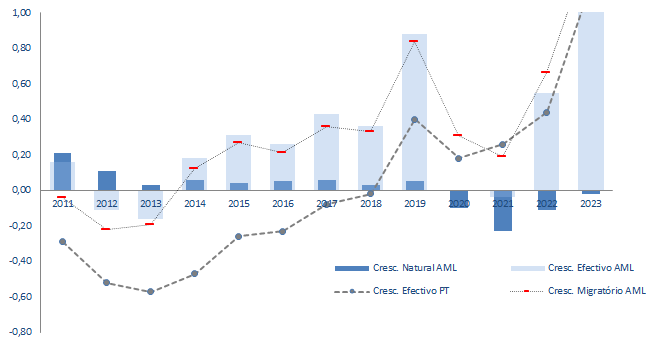
Figure 2 – Effective Growth Rate in the Lisbon Metropolitan Area 2011-2023
Source: INE, Demographic indicators. Effective growth rate (%) by Place of residence (NUTS – 2013); Annual (current. July 2024).
Although the natural, migratory and effective growth rates provide an overview of the region, this analysis must be accompanied by other indicators, namely information from the 2021 Census regarding the resident population. From the analysis of the information from these Censuses, we can see that the Lisbon Metropolitan Area is increasing its population (number of individuals), though timidly (+1.71%) compared to 2011, taking into account natural growth and migratory growth. Of the total resident population in the Lisbon and Tagus Valley region, 87% live in predominantly urban areas.
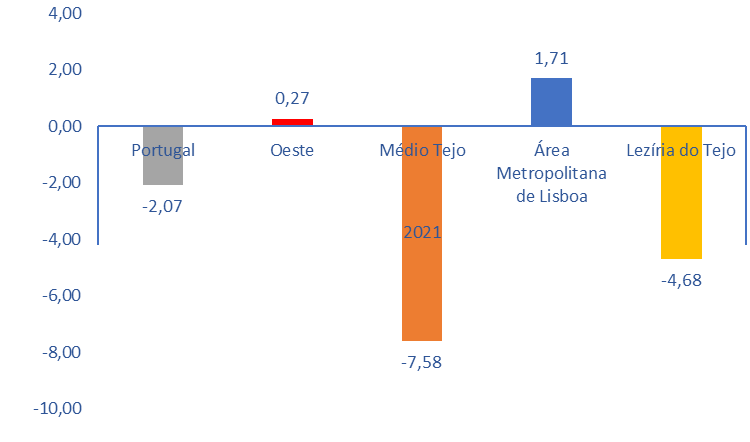
Figure 3 – Resident population variation rate 2011-2021
Source: INE – Resident population variation rate (2011-2021) (%) by Place of residence (at the date of the 2021 Census), Sex and Age group (By life cycles); Decennial (Nov. 2022)
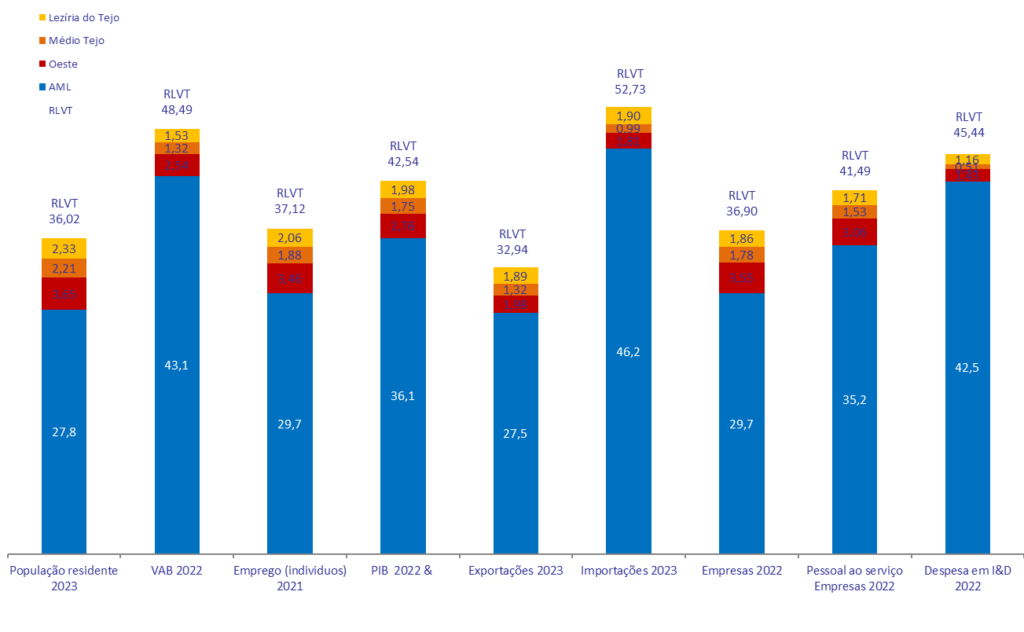
Figure 4 – Weight of Lisbon and Tejo Valley Region and its Sub-regions in the Country: main indicators
Source: (data July 2024) Resident population (No.) by Place of residence (NUTS – 2013), Sex and Age group; Annual – INE, Annual estimates of the resident population; Gross value added (€) of Companies by Geographical location (NUTS – 2013) and Economic activity (Division – CAE Rev. 3); Annual – INE; Employment rate (Series 2021 – &-provisional data) by Place of residence (NUTS – 2013), Sex and Age group; Annual; Gross domestic product (B.1*g) at current prices (Base 2016 – €) by Geographical location (NUTS – 2013); Annual – INE; Exports (€) of goods by Geographical location (NUTS – 2013); Annual – INE; Imports (€) of goods by Geographical location (NUTS – 2013); Annual – INE; Enterprises (No.) by Geographical location (NUTS – 2013) and Economic activity (Subclass – CAE Rev. 3); Annual – INE; Personnel employed (No.) by Enterprises by Geographical location (NUTS – 2013) and Employment level; Annual – INE; Research and development (R&D) expenditure – €) by institutions and enterprises with research and development by Geographical location (NUTS – 2013) and Implementation sector; Annual – DGESS (Directorate-General for Education and Science Statistics), National scientific and technological potential (institutional sector and enterprise sector).
The Region generates 48.49% of GVA, 42.54% of national GDP, 37.12% of employment and 32.94% of exports of goods, 52.73% of imports and 45.44% of expenditure applied to research & development, which is contributed to by the fact that it is home to some of Portugal’s main scientific and technological, economic, financial and political infrastructures.
The Region articulates an Atlantic Macroregion and assumes itself as the driving force of national development, concentrating 36.90% of the number of companies and 41.49% of the personnel serving the country, offering a diversity of landscapes, activities and cultures that make it a dynamic and highly attractive region.
The management of this territory has specific features that require additional efforts to coordinate and articulate public policies, entities and planning and programming instruments, for reasons related to the gap between territorial administrative units for the purposes of regional development, strategic planning and territorial management (the area under the jurisdiction of the CCDR-LVT, I.P.) and for the purposes of applying community funds. Nevertheless, there is a macro-urban, regional system that complements and reinforces the polarisation exercised by the Lisbon Region, which manifests itself in a network of cities and agglomerations, in a polycentric network with different levels of interdependence (supramunicipal, sub-regional and regional). It is at this level that the Region asserts itself in the national and European context. Given the importance of this Region in the country, broadly expressed in the main economic and territorial indicators (figure 4), the strategic dimension of the mission of the CCDR-LVT, I.P. acquires paramount importance in the context of national development, which increases the importance of this activity plan.
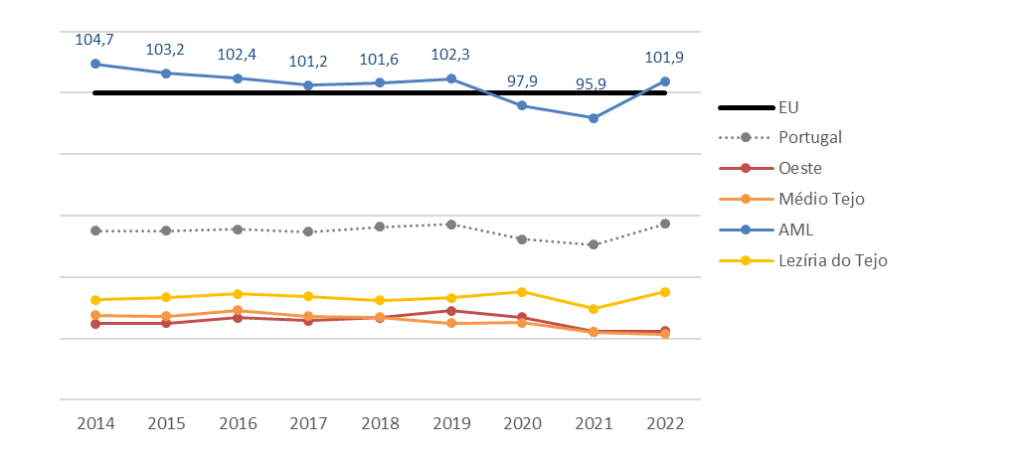
Figure 5 – Evolution of GDP per capita (PPP) in the Lisbon and Tejo Valley Region (EU27=100) – 2011-2022
Source: Gross domestic product per inhabitant in PPP (EU27=100) (Base 2016 – %) by Geographical location (NUTS – 2013); Annual – INE, Regional economic accounts; (March 2024).
At regional level, the Lisbon Metropolitan Area remains in the group of the most developed regions on a national scale, and which presents a greater distance from the national average in GDP per capita in Purchasing Power Parities.
Despite the drop after the pandemic, 2022 is the first year of recovery for the AML, once again standing above the European average and with values close to 2019, with the remaining NUTS III regions below the European average, but Lezíria do Tejo in an increasing direction.
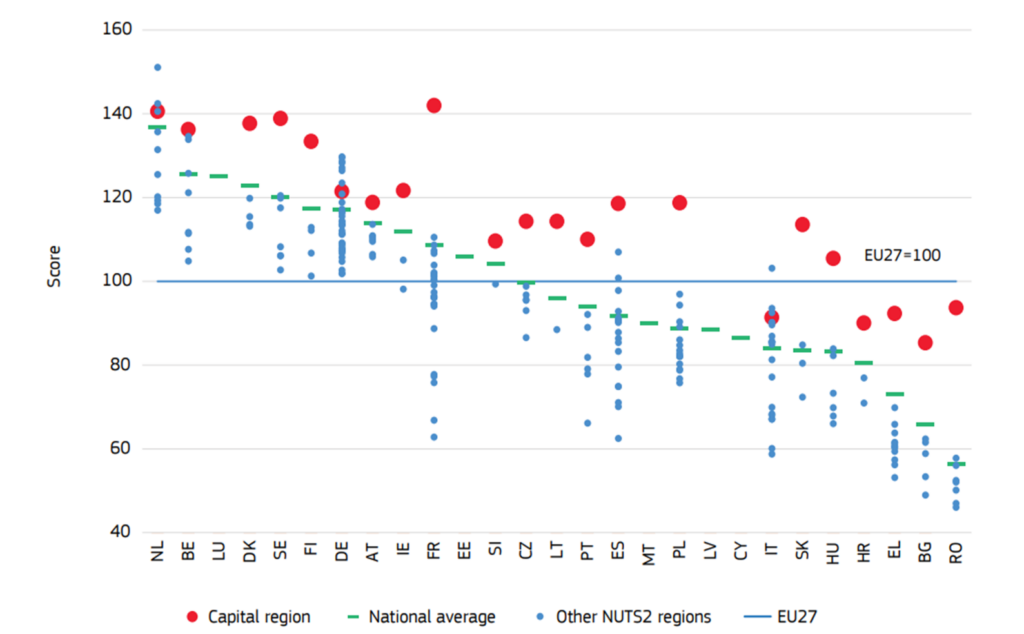
Figure 6 – Regional variation by EU Member State – RCI 2.0 – 2022 edition
Source: https://ec.europa.eu/regional_policy/sources/work/rci_2022/eu-rci2_0-2022_en.pdf; Directorate-General (DG) for Regional and Urban Policy and Joint Research Centre. NB: Member States ranked by national averages. There is a gap between the year mentioned in the RCI title and the actual data used for the calculations (i.e. RCI 2.0-2022 mainly uses data up to 2019, before COVID-19 and the war in Ukraine).
Portugal has been investing in innovation and competitiveness, as well as in digital transformation and in sectors with higher added value, namely in the medium and high technology tradable goods industries, together with the stimulus to public investment in R&D sectors, namely in aeronautics/space, and health technologies, with an increase in exports and a reduction in imports. The importance of focusing on increasing productivity is essential for us to have a more competitive country. The investment in innovation and digital transformation will increase entrepreneurial capital as well as the attraction of talent, higher education and its interconnection with companies and other institutions as a guarantee of cooperation and economies of scale, with particular emphasis on the Lisbon Region.


